Value Stream Mapping (VSM)

We all have value streams. Some are simple, some are complex, and some are organised around the flow of value. We map our value steams to understand and visualise the process, and to identify where problems disrupt the flow of value.

In this simplified walk-through, we use a three-step value stream mapping to visualise your process, such as your continuous delivery pipeline, and highlight bottlenecks and waste with actionable metrics.

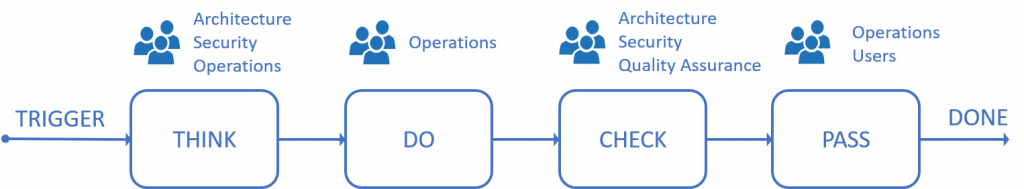
Step 1 – Visualise all activities

Map all the activities from ideation to deprecation. No activity or step is too trivial to be part of your value stream map!

Figure – Value Stream Activities

Step 2 – Identify stakeholders

Next, show all the stakeholders, who are directly involved in each activity of your process. It is important that we understand who is involved and accountable for the work performed!

Figure – Value Stream Stakeholders

Step 3 – Measure, measure, measure!

To uncover bottlenecks, waste, and problems, originating from upstream activities, you need to calculate and visualise value stream measurements.

The lead-time is the time an activity is ready to be worked on to its completion. Think of it as the time from when you place an order at a restaurant to when the meal is served. When you must wait a long time (long lead-time), you are not delighted!

The cycle time is the valuable time spent doing the actual work to complete the activity. This is like the time it takes the kitchen to cook your meal.

The efficiency percentage is a ratio of an activity cycle and lead time. Low efficiency percentages signify an opportunity to remove waste and bottlenecks.

Lastly, the quality percentage signals how well we are handling quality at each activity. The higher the %, the less rework (waste) is needed to move through our process.

Figure – Value Stream Metrics
Lighthouse
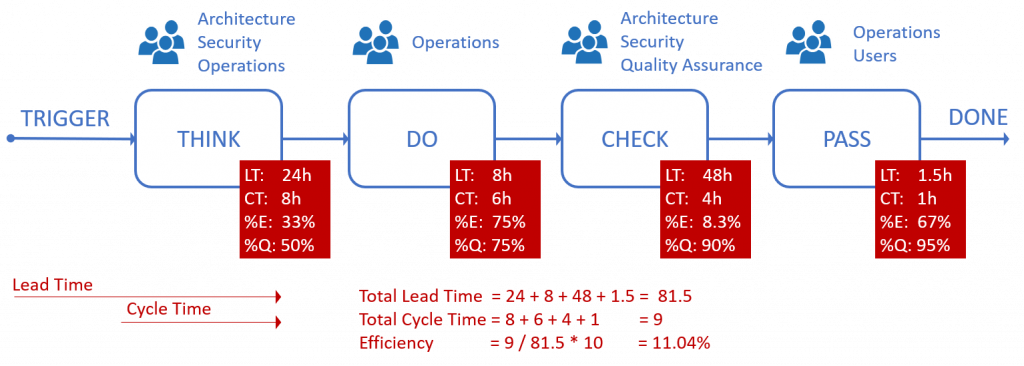
Look for activities:
– With low efficiency – CT/LT*100
– With long lead times, those with short cycle times
Question: Why are we waiting to get the work done?
– With poor efficiency percentages
Question: Why do we need to rework activities?
METRICNOTE
Lead Time (LT)Time from earlier activity to end of current activity
Cycle Time (CT)Time to complete the activity
%Efficiency (%E)CT/LT – Effectiveness
%Quality (%Q)% of earlier activities with no rework
Total LTTLT – Sum of all lead times
Total CTTCT – Sum of all cycle time
Total %ETCT/TLT – Overall effectiveness
Table – Value Stream Metrics
“I recommend that you hang a copy of your value stream mapping diagram in high-traffic and high-visibility areas. That allows your team and other stakeholders to review and discuss the learnings and add their unsolicited feedback.
For example, your team’s breakout area, cafeteria, or outside the restrooms.”

Share this post

Download our free white paper on Technical Debt and Business Agility.

Fill out the form below, and we will send you a white paper along with a drawing for a free drawing for our DevOps book!

Ready to level up your career?

Recent Posts

Add to Waitlist

If a course has an ‘add to waitlist’ button then it is likely booked up. Spots often become available so please fill out the form below. We will be in touch within 24hrs

CIO

Born 1965, San Antonio, Texas and lives in Dallas, Tx.
Mr. James, Ronald, Maverick holds a Bachelor of Science in Psychology at The University of Texas, San Antonio.

Mr. Maverick or JR as many call him is a “slick” but warm and friendly character in our upcoming book on the DevOps Mindset. Mr. Maverick cares about his IT team very much and could charm the socks off a Texas Longhorn. JR is liked by many in his organization; however, he is not as well trusted by the Overlords as he used to be. Mr. Maverick has a group of loyal staff, including Mr. Barker a bit of an opposite to JR. Of course, Mr. Barker would never call him JR; he would only call him Mr. Maverick because well, Mr. Maverick is his boss. Mr. Maverick has held many IT positions in the past, including starting as a Sales Professional for HP and IBM mini and mainframe computers. Over the years he has risen through the ranks to hold this senior position by delivering using high-paid consultants and Big name firms. He also received his promotion from outsourcing to a foreign country where he was able to reduce his IT spend significantly. Recently he has discovered (actually this was made painfully aware to him by the Overlords) that both the Offshore roadmap and use of external consultants was not giving him the value and velocity for his IT department, and he was probably paying more than he bargained for

So, after hearing a talk at a DevOps event by the Agents of Chaos, JR decided to enlist them to help with their digital transformation roadmap and help improve the value, focus and velocity of his department. However, MR. Maverick has a few ideas about agile and DevOps, something he has heard about for a while and read in various CIO magazines; he thinks of these as Marketing terms and something that can be bought. While Mr. Maverick has held on for many years to traditional IT ways of working he has come to the end of his tenure if he doesn’t do something fast and get DevOps working quickly as he has promised to the Overlords providing him with a little more rope to get the transformation completed more quickly as they view his IT department ageing, procrastinators who are not able to keep up with business demands. JR says in his mind, “I will get it done, they don’t call me Maverick for nothing!“